0.3.2.
Residence Time Distribution Curves
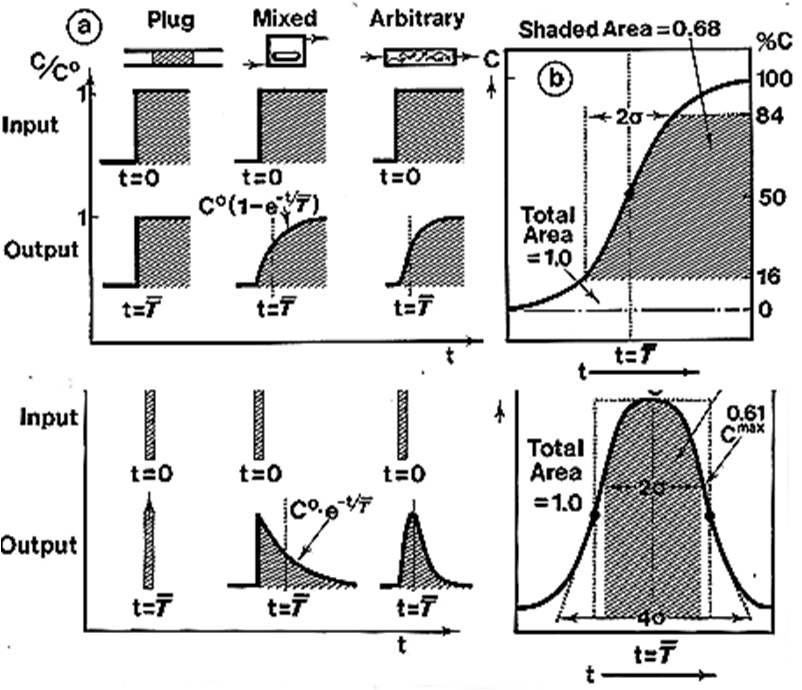
Transport and mixing in flowing media form the underlying principle of all analytical systems based on continuous flow and programmable flow. This concept is treated in depth in textbooks on chemical reaction engineering. (Levenspiel 1972) Briefly, the flow process modifies the shape of an original input yielding an RTD curve, monitored at the vessel exit. The initial input obtained with a dye of concentration C^0 may have a form of an abrupt step (A) which yields a so called F-curve. Alternatively the RTD curve can be obtained by injecting a pulse of a dye, (B) the broadening of which, when monitored will yield a C-curve.


A
B
D
E
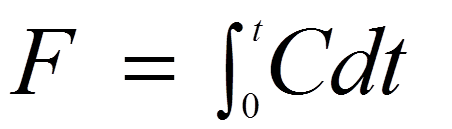
For plug flow the input and output are identical. For mixed flow the step input is transformed to exponentially growing F curve. For a pulse input into an exponentially decreasing C-curve. The arbitrary flow, to which a majority of flow system conform, the slope of the F curve (D) and symmetry the C curve (E) will increase with the number of mixing stages through which the sample plug has passed. The standard deviation of these curves equals axial dispersion and the time span between the input and the mean of the output curve is mean residence time. The F-curve is an integral of c curve: